
Fresh thinking from the team
at Sketch Group
Browse our articles by topic or publication date.
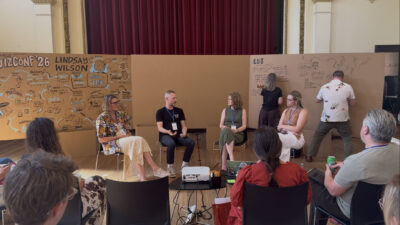
VizConf 2026: A reminder of where I belong
Matt gets all deep and mushy as he reflects on the recent VizConf conference.

Visual Storytelling: How A Video Turned Insights Into Action
A newly published journal article shows how an animated video we co-created with University of Newcastle researcher Caroline Gibson helped general practice nurses gain confidence in recognising and responding to signs of dementia. This is a powerful example of research made accessible through visual storytelling.
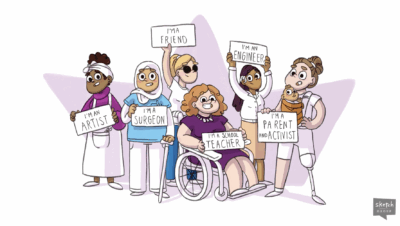
Why Sketching and DEI Are Such a Natural Fit
When we talk about diversity, equity, and inclusion (DEI), we often focus on representation, policy, or language. But there’s another, often-overlooked dimension: how we communicate ideas.

How Visual Metaphors Boost Team Alignment and Clarity
When it comes to collaboration, teams often use the same words but imagine very different […]
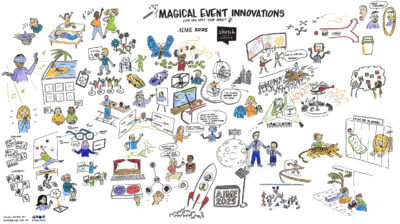
IdeaSketch™: A Creative Way to Amplify Voices at Events
What if one question could spark fresh thinking, energise your event, and create a stunning visual centrepiece? That’s the magic of IdeaSketch.

VisionSketch™ for Business Growth and Strategy
A VisionSketch™ is more than just a drawing—it’s a visual roadmap that turns your business goals into a clear, actionable plan. By combining strategy with creative visuals, it helps teams align, stay focused, and bring their future vision to life.
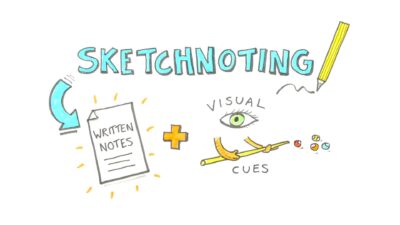
Why Everyone Should Learn to Think with a Pen (Yes, Even You!)
In a digital world full of keyboards and screens, the humble pen is still one of the most powerful tools for thinking. Writing and sketching by hand helps you process ideas, solve problems, and remember more—no matter your role or skill level. Discover why everyone should learn to think with a pen—and how even simple doodles can unlock clearer, smarter thinking.
5 Key Benefits of Live Scribing in Corporate Strategy
In corporate strategy sessions, clarity and alignment are key. Live scribing, or graphic recording, captures discussions in real time, turning ideas into visual maps of diagrams, icons, and illustrations. This not only enhances understanding and retention but also makes abstract concepts more accessible. The resulting visuals provide lasting references that reinforce key messages long after the session ends.
5 Ways to Help Your Graphic Recorder Capture the Best Results
Planning an event takes countless moving parts—and your graphic recorder is one of them. A little preparation goes a long way in helping them capture ideas clearly and creatively.
Insights delivered monthly to your inbox
Our market-leading Feelin’ Sketchy newsletter is an invaluable source for visual thinking, analysis and learning. No fluff. No special offers involving steak knives. Just great content.
We never spam, our promise!