
Fresh thinking from the team
at Sketch Group
Browse our articles by topic or publication date.
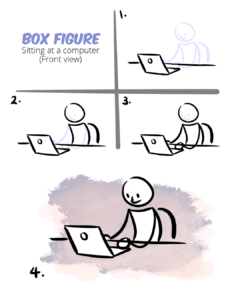
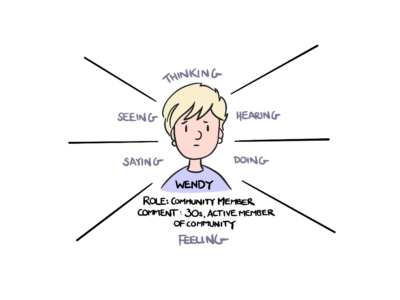
How to Use Box Figures to Show Emotions & Actions
Think you can’t draw? Think again. Discover how simple box figures can communicate feelings, actions, and ideas with just a pen and paper.
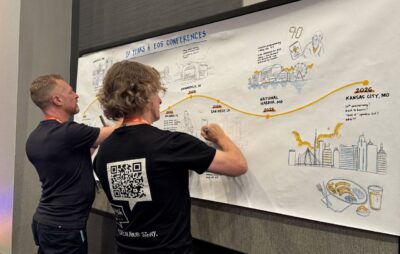
Drawn together…literally!
Graphic recording is usually a solo pursuit — but not this time.
When the EOS Conference in Kansas City asked us to illustrate an entire decade of conference history live at their reception, we divided and conquered — splitting illustrations, lettering, and colour across the team to beat the clock.
The result was more than a graphic record. It became an archive, a conversation piece, and a nostalgia trigger all at once.
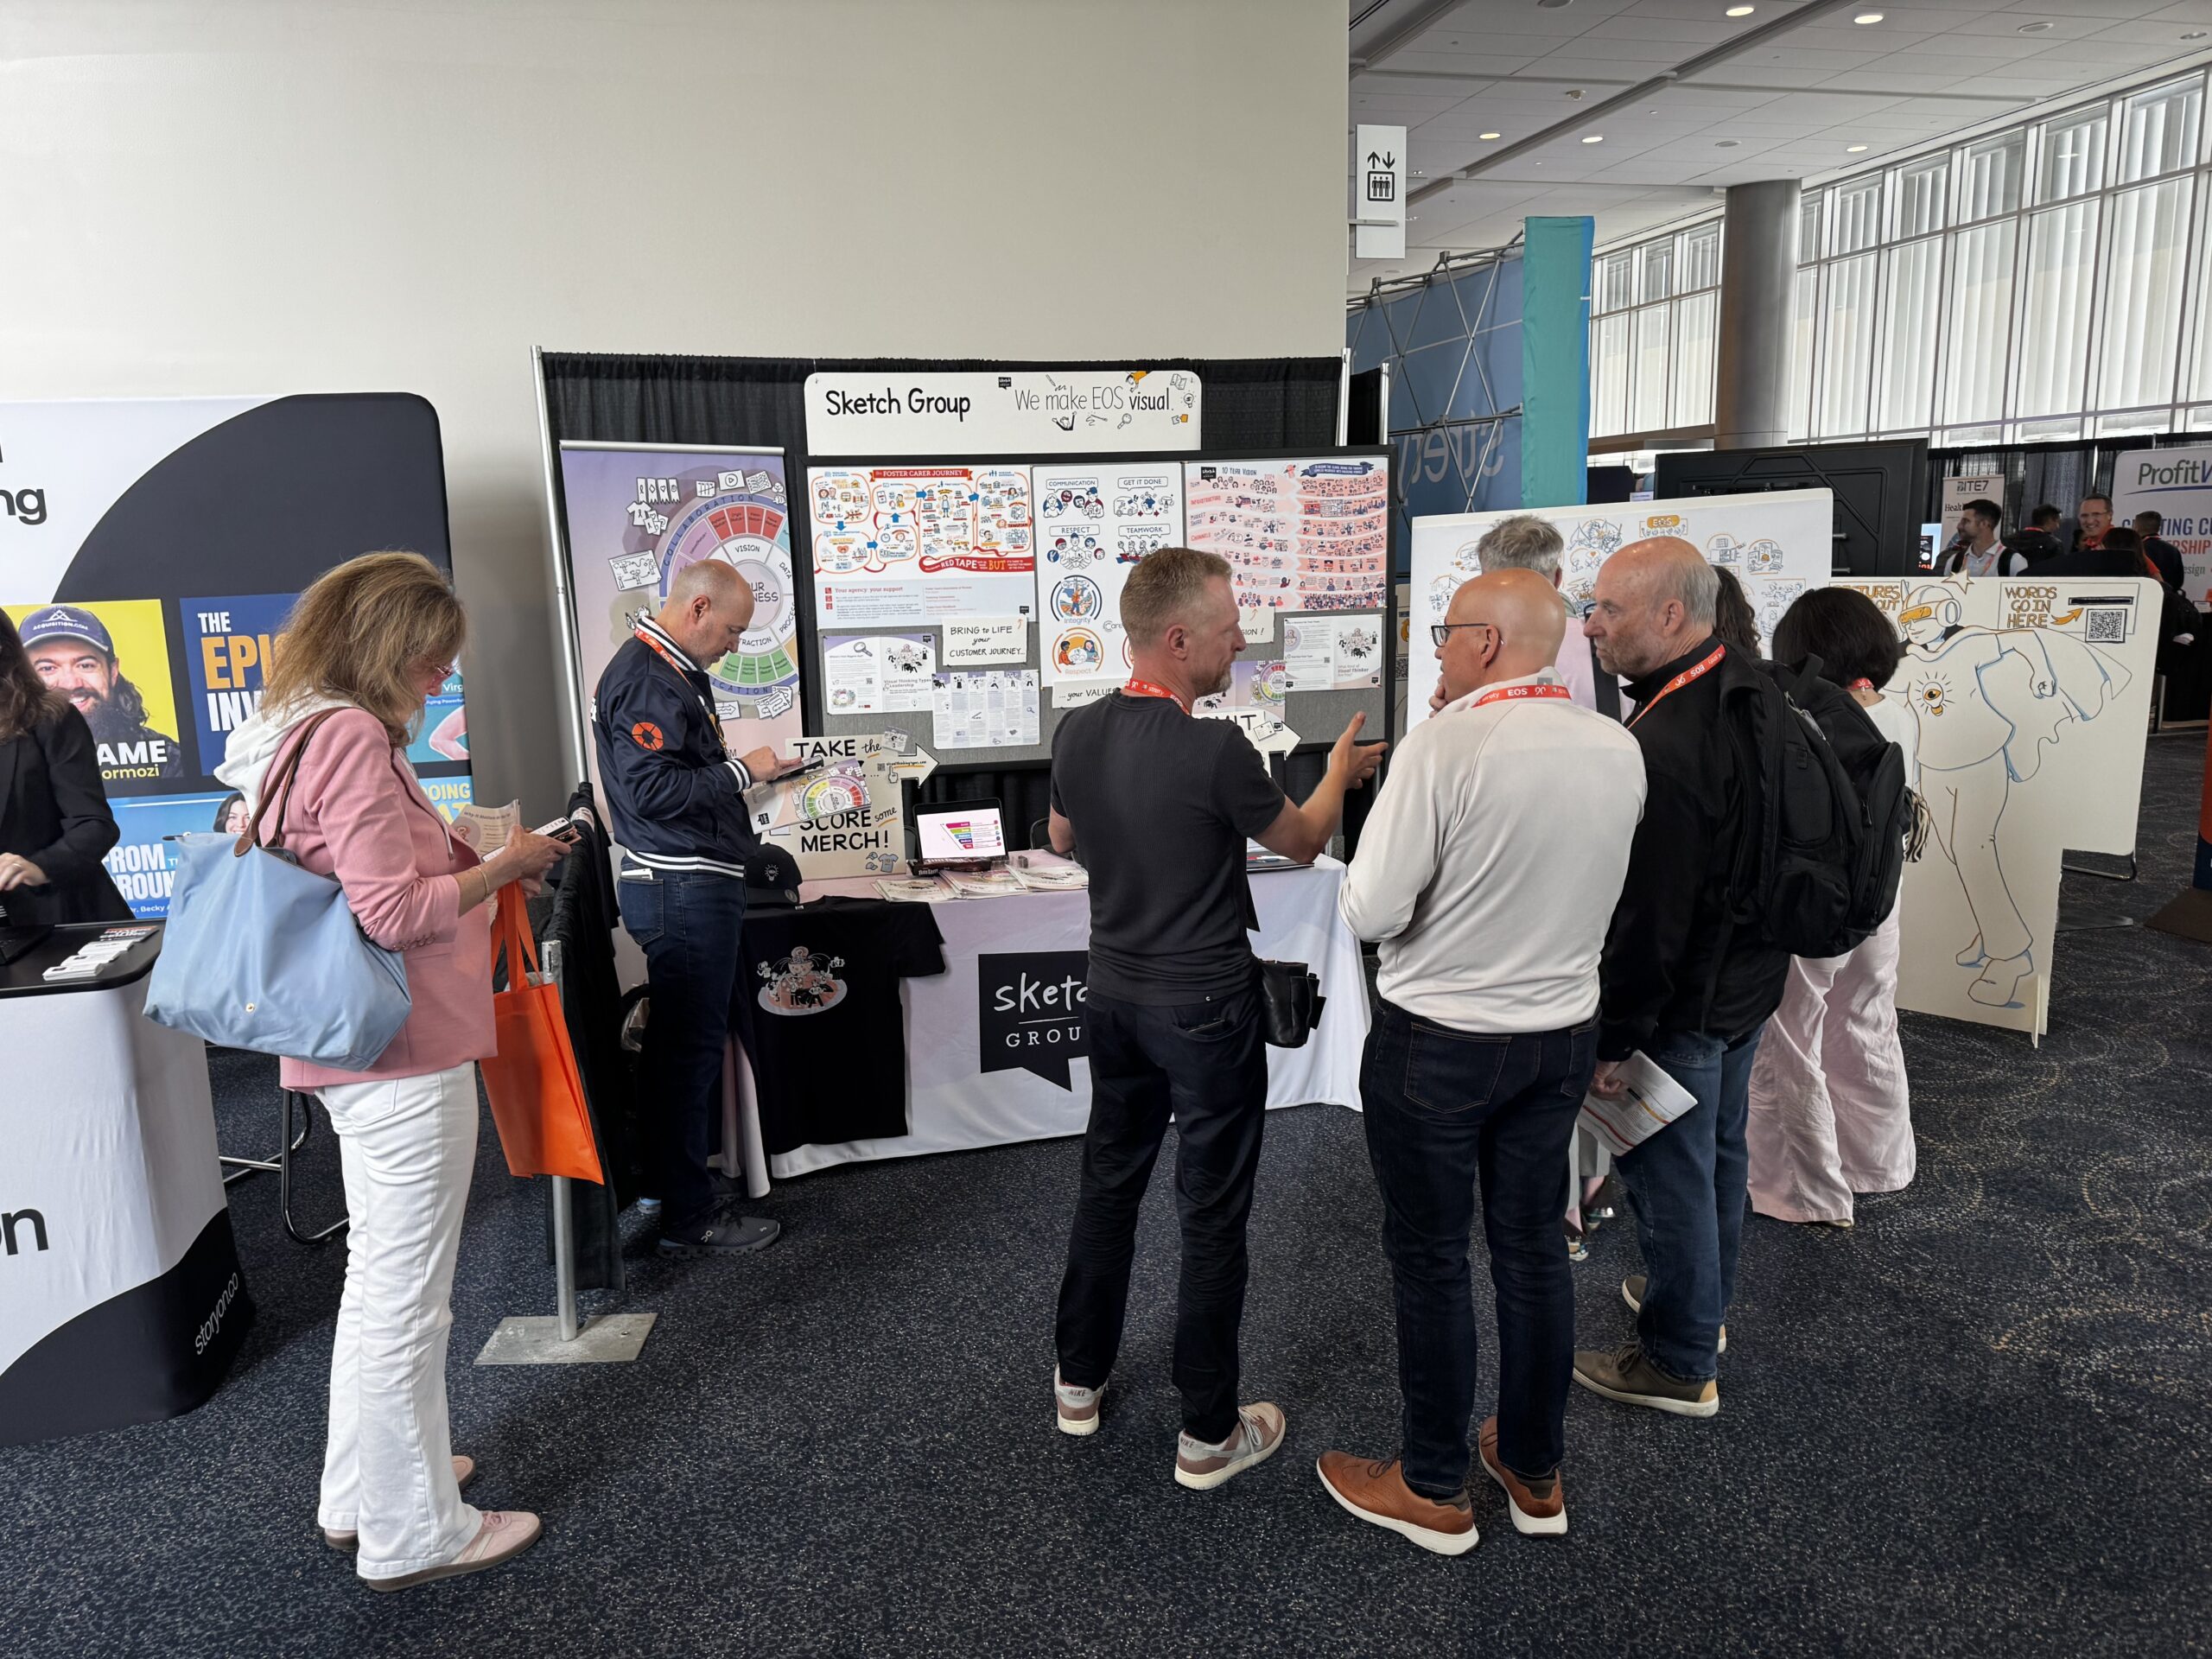
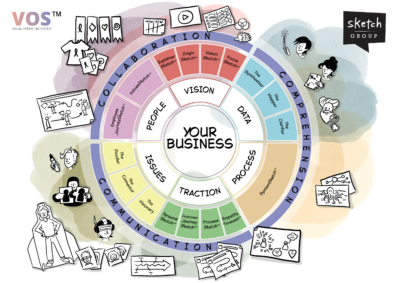
What Happens When Thinking Becomes Visible
Most organisational problems aren’t caused by lack of effort or talent — but the real culprit might surprise you. At the 2026 EOS Worldwide Conference, the Sketch Group team put our Visual Operating System in front of a room full of no-nonsense business operators and coaches, and the response was overwhelming.
We’re heading to Kansas City … and we’re bringing the Tim Tams
In two days, the Sketch Group team flies out to sponsor our first-ever international conference: the 2026 EOS Conference in Kansas City, Missouri.
The Empathy Forecast: A Foundation for Communication Success
Discover how empathy drives successful communication in our latest article. Learn practical tips to connect, engage, and make your messages more impactful.
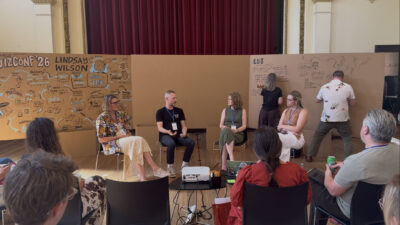
VizConf 2026: A reminder of where I belong
Matt gets all deep and mushy as he reflects on the recent VizConf conference.

Visual Storytelling: How A Video Turned Insights Into Action
A newly published journal article shows how an animated video we co-created with University of Newcastle researcher Caroline Gibson helped general practice nurses gain confidence in recognising and responding to signs of dementia. This is a powerful example of research made accessible through visual storytelling.
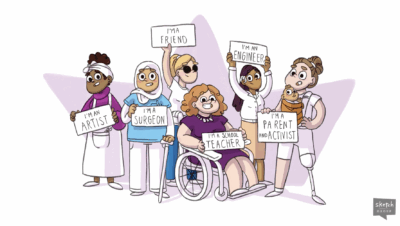
Why Sketching and DEI Are Such a Natural Fit
When we talk about diversity, equity, and inclusion (DEI), we often focus on representation, policy, or language. But there’s another, often-overlooked dimension: how we communicate ideas.

How Visual Metaphors Boost Team Alignment and Clarity
When it comes to collaboration, teams often use the same words but imagine very different […]
Insights delivered monthly to your inbox
Our market-leading Feelin’ Sketchy newsletter is an invaluable source for visual thinking, analysis and learning. No fluff. No special offers involving steak knives. Just great content.
We never spam, our promise!