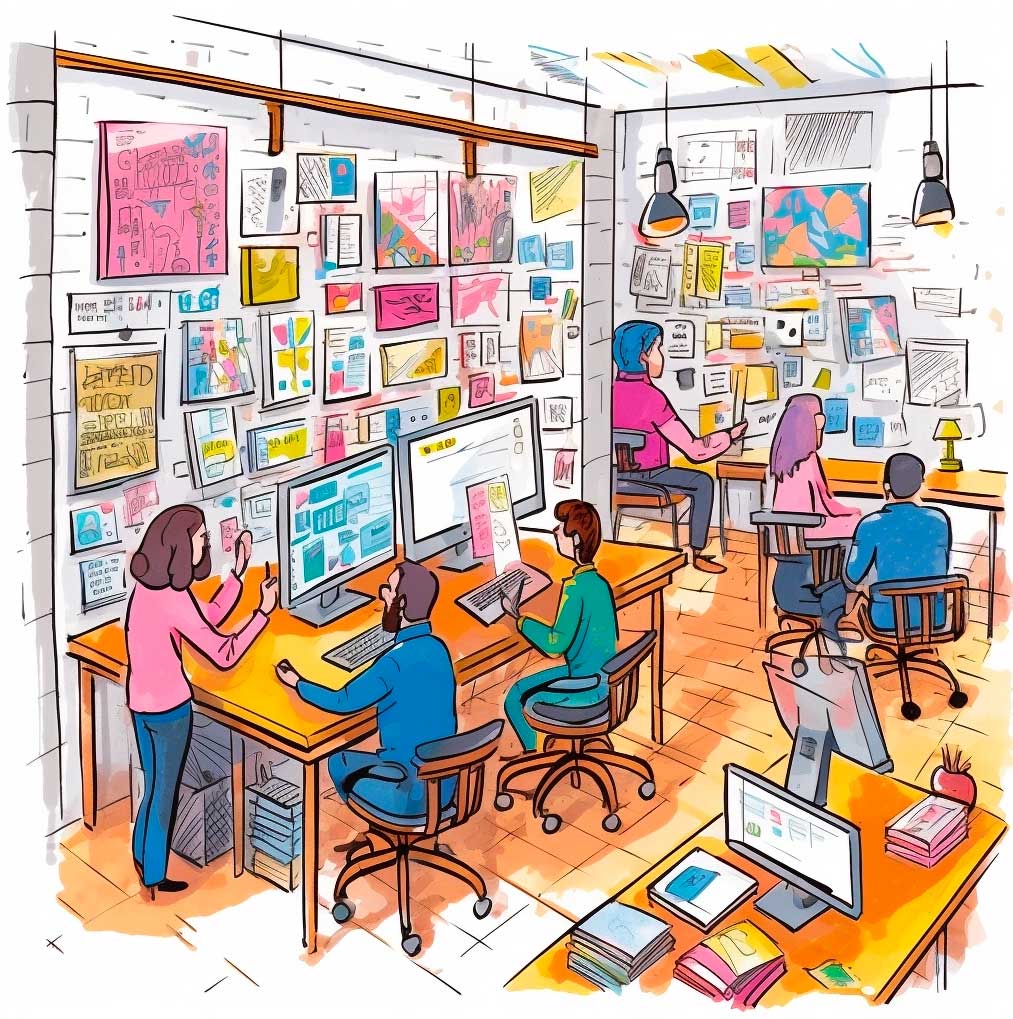

Like many people, I’ve been watching the landscape of fast-moving AI tools with equal parts excitement and horror. Will it put us all out of a job? Will it make us all better at our jobs? Who knows? I back my team and myself on our ability to bring a human touch to the work we deliver, but I guess time will tell.
What AI tools are good for, however, is generating ideas. For example, a list of ways that visual thinking can be useful in the workplace. I asked ChatGPT to give me a big list, and what it spat out was amazing. It reads like a bucket list for someone who visualises things professionally, like me.
Behold, the monster list:
- Problem-solving: Visual thinking can help in identifying and understanding complex problems by visualising them through diagrams, mind maps, or flowcharts.
- Brainstorming: Visual techniques such as concept mapping or visual boards can facilitate creative brainstorming sessions and stimulate idea generation.
- Planning and organising: Visual tools like Gantt charts or Kanban boards can aid in project planning, task allocation, and tracking progress.
- Process mapping: Visual diagrams, such as process flows or swim-lane diagrams, can be used to map out workflows, identify bottlenecks, and optimise processes.
- Data visualisation: Visual representations of data, such as charts, graphs, or infographics, can make complex information more accessible and facilitate data-driven decision-making.
- Communication: Visuals, including presentations, illustrations, or visual aids, can enhance communication by conveying information more effectively and engagingly.
- Storytelling: Visual narratives, such as storyboards or comics, can be used to communicate concepts, strategies, or project plans in a compelling and memorable way.
- User experience (UX) design: Visual thinking is crucial in designing user-friendly interfaces, wireframes, or prototypes to create intuitive and visually appealing user experiences.
- Customer journey mapping: Visualising the customer journey can help identify pain points, understand user behaviour, and enhance customer satisfaction.
- Training and onboarding: Visual materials like instructional videos, infographics, or visual guides can aid in training new employees and conveying complex concepts.
- Decision-making: Visual frameworks, such as decision trees or decision matrices, can assist in structuring decisions, evaluating options, and considering various factors.
- Strategic planning: Visual tools, like strategy canvases or SWOT analysis diagrams, can support strategic planning processes and facilitate alignment among team members.
- Knowledge sharing: Visual representations, such as mind maps or visual summaries, can simplify complex information and promote knowledge sharing within teams or across departments.
- Project management: Visual techniques like project timelines, milestone charts, or burn-down charts can help monitor project progress, track tasks, and manage resources.
- Problem analysis: Visual problem-solving methods, such as fishbone diagrams or mind maps, can aid in identifying root causes, exploring relationships, and developing solutions.
- Collaboration: Visual thinking encourages collaborative work by fostering shared understanding, promoting participation, and facilitating group decision-making.
- Strategy development: Visualising strategic objectives, action plans, or roadmaps can help align teams, track progress, and communicate the overall direction of the organisation.
- Mindfulness and reflection: Visual journaling or visual reflections can assist in introspection, self-awareness, and promoting a mindful work environment.
- Marketing and advertising: Visuals play a vital role in creating impactful marketing materials, designing advertisements, and conveying brand messages effectively.
- Change management: Visual techniques like change impact analysis or change readiness maps can assist in managing organisational change by visualising its effects and planning mitigation strategies.
- Risk management: Visualising risks through risk matrices, heat maps, or risk assessment diagrams can aid in identifying, prioritising, and managing risks within projects or processes.
- Innovation and ideation: Visual thinking can stimulate creativity and innovation by using techniques like mind mapping, sketching, or visual brainstorming sessions.
- Customer feedback analysis: Visual representations, such as sentiment analysis visualisations or customer journey maps, can help analyse and understand customer feedback more intuitively.
- Performance tracking: Visual dashboards, scorecards, or performance heat maps can provide a quick overview of key performance indicators (KPIs) and track progress towards goals.
- Presentation design: Visual thinking is essential in creating engaging and visually appealing presentations that effectively communicate key messages and captivate the audience.
- Prototyping: Visualising ideas through sketches, wireframes, or mockups helps in rapid prototyping and gathering feedback for iterative improvements.
- Sales and pitch presentations: Visuals are powerful tools in sales presentations, pitch decks, or product demos, helping to highlight key features, benefits, and value propositions.
- Training material design: Visual thinking can enhance the design of training materials by incorporating visual aids, diagrams, or interactive elements for better engagement and understanding.
- Process improvement: Visual representations, such as value stream maps or process flow diagrams, can aid in identifying inefficiencies, streamlining workflows, and driving continuous improvement.
- Knowledge management: Visual knowledge repositories, like visual libraries or visual databases, can facilitate easy access, retrieval, and sharing of information within an organisation.
- Root cause analysis: Visual techniques, such as fault tree analysis or causal loop diagrams, can assist in identifying and analysing the root causes of problems or incidents.
- Resource planning: Visualising resource allocation, workload distribution, or resource availability through visual tools like resource calendars or heat maps can aid in efficient resource planning.
- Quality control: Visual methods, such as control charts, Pareto diagrams, or scatter plots, can help monitor quality metrics, identify trends, and initiate corrective actions.
- Competitive analysis: Visualising competitive landscapes, SWOT analyses, or market positioning maps can provide insights into competitors’ strengths, weaknesses, and market opportunities.
- Human resources management: Visual tools, such as organisational charts or competency matrices, can support HR processes like talent management, succession planning, or skills assessment.
- Knowledge transfer: Visualising tacit knowledge through techniques like mind mapping, knowledge maps, or visual storytelling can facilitate knowledge transfer between employees.
- Stakeholder mapping: Visual representations, such as stakeholder influence grids or power-interest matrices, can aid in identifying key stakeholders, their relationships, and engagement strategies.
- Conflict resolution: Visual methods like conflict resolution diagrams or negotiation frameworks can assist in understanding conflicts, exploring resolutions, and promoting constructive dialogue.
- Recruitment and hiring: Visual materials, such as job advertisements, visual job descriptions, or employer branding visuals, can attract and engage potential candidates.
- Goal setting and tracking: Visualising goals and progress through goal boards, vision boards, or goal trackers can increase motivation, focus, and accountability.
- Project retrospectives: Visual techniques, such as timeline analysis, fishbone diagrams, or impact-effort matrices, can facilitate project retrospectives and lessons learned sessions.
- Workflow optimisation: Visual thinking can help identify redundancies, bottlenecks, or process gaps through techniques like value stream mapping, spaghetti diagrams, or process visualisation.
- Conflict resolution: Visual methods like conflict resolution diagrams or negotiation frameworks can assist in understanding conflicts, exploring resolutions, and promoting constructive dialogue.
- Workforce diversity and inclusion: Visuals can be used to promote diversity and inclusion initiatives through visual campaigns, awareness materials, or inclusive design approaches.
- Social media and content marketing: Visual content, such as infographics, videos, or visual quotes, can enhance engagement, reach, and virality of social media and content marketing efforts.
I view this is a checklist of opportunity—a comprehensive collection of the ways that thinking, communicating, and collaborating in the workplace can be improved by picking up a pen. I’ve been through and checked off a bunch, but there are plenty of others that offer food for thought.
Thanks ChatGPT for reminding me of the ways that my team and I can help people thrive—in ways that a computer cannot.