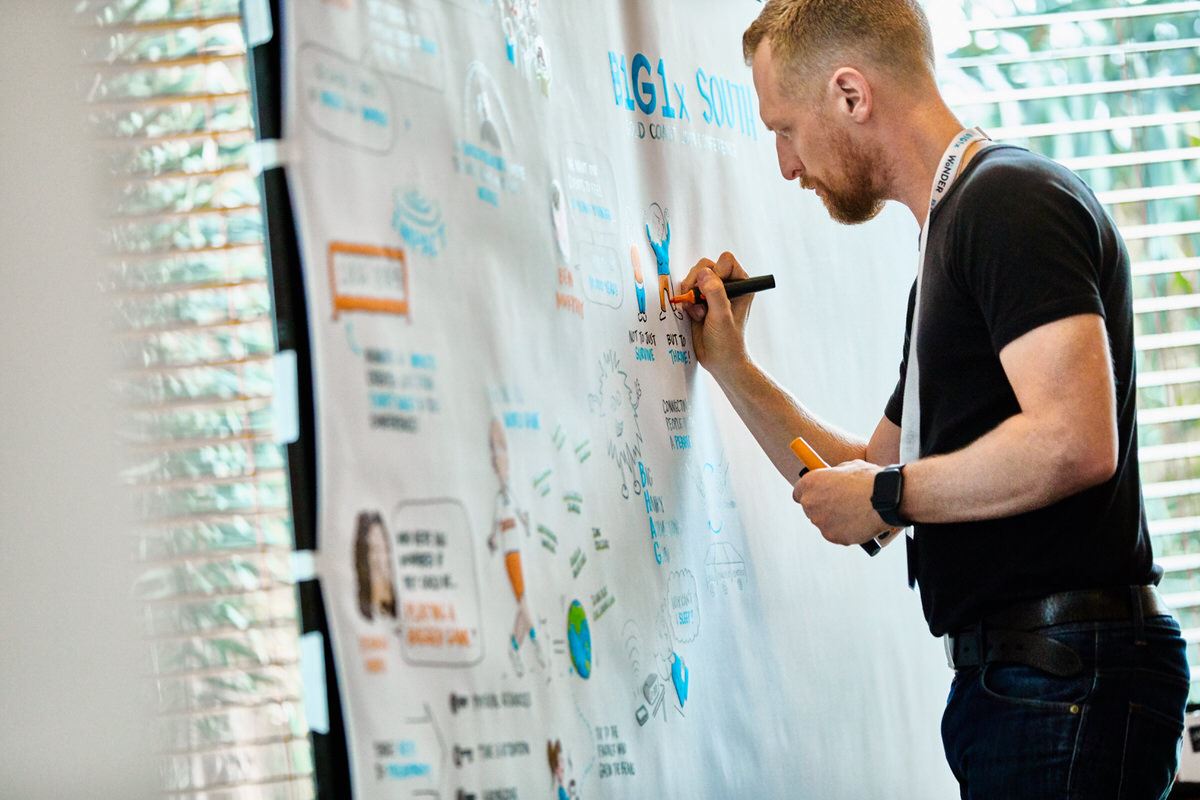
Graphic Recording for Government
Pioneering innovative forms of communication within the public sector.
Listen, synthesize, draw. In real time.
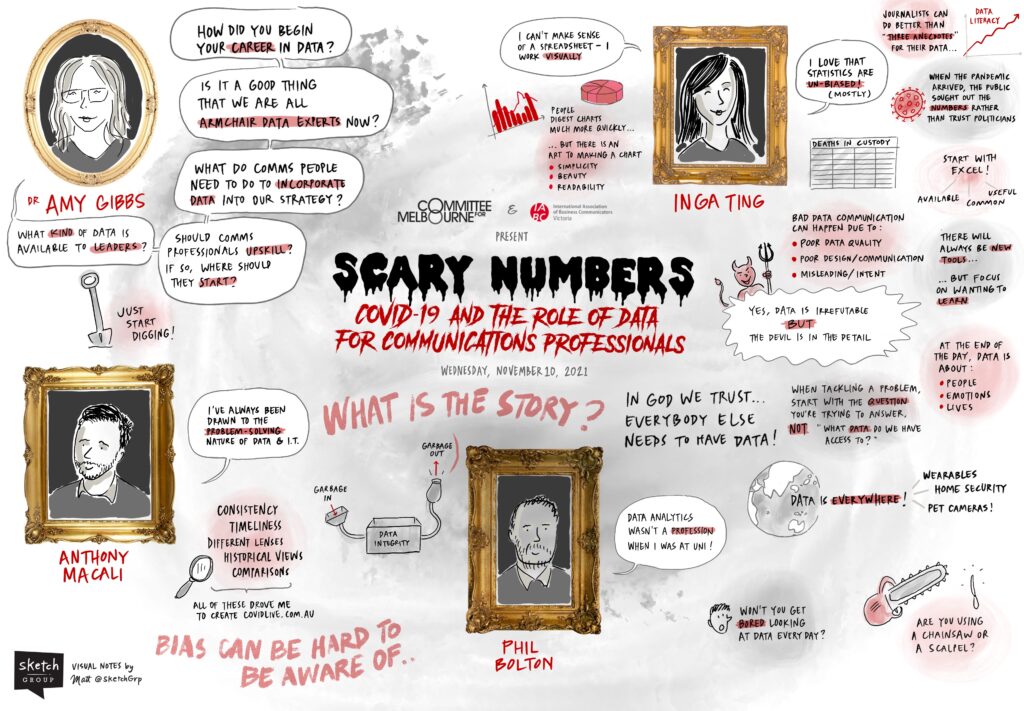
Graphic recording is an incredibly powerful tool for capturing and communicating ideas, concepts, and discussions. The ability to visually synthesise complex information and convey it in a simple and memorable format makes it perfect for helping government departments, agencies, and team members to better understand and communicate important information.
Challenges of Running Government Events
During the 10+ years that we’ve worked with clients from all levels of government, we’ve seen the same challenges appear time and again. These include:
- Stakeholder management: getting everyone on board, especially on projects when there are a dozen or more people with a vested interest in the project’s success, is hard!
- Social media debate: heated backlash from Facebook community groups, Twitter trolls, or Insta-warriors are just some of the hurdles of the modern age when communicating information that affects everyone.
- The election cycle: the goal posts could be changed, a project could be parked for 12 months, or dropped altogether based on the winds of political change.
- Perceived bias: it’s challenging to get the language and visuals right without getting minorities offside, or playing into perceived bias from any one political party or agenda.
- Revolving doors: let’s face it—there are some roles in the public sector that just burn people out. Everyone has their limit! But if everyone key to a project moves onto other roles, how does anything get delivered?
How Graphic Recording can Help
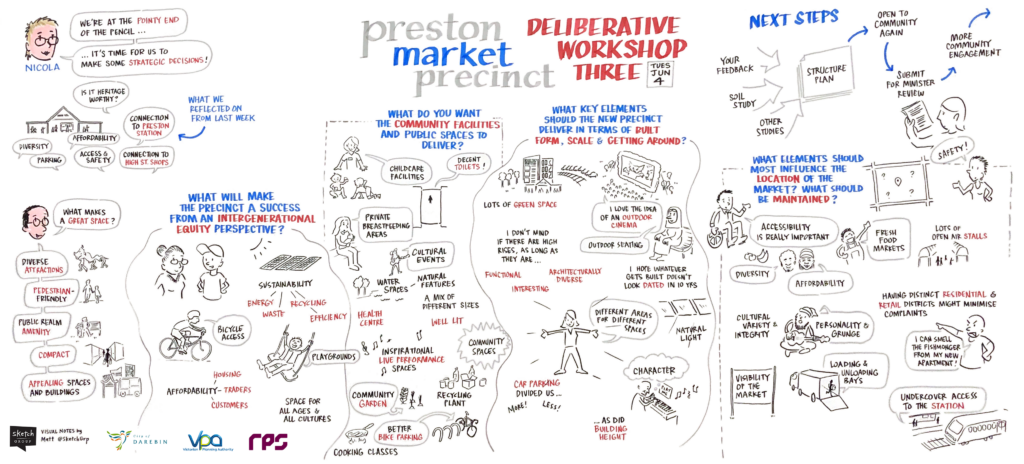
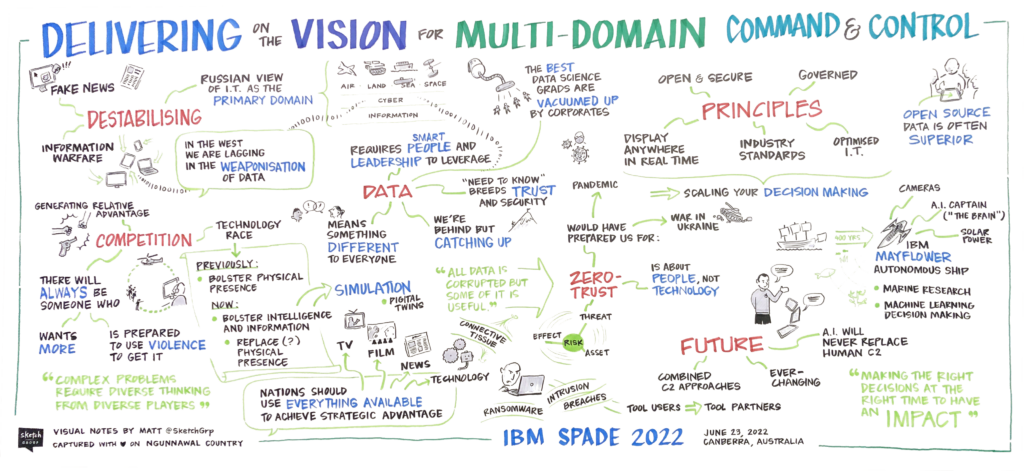
Everyone loves watching someone draw, so having someone use visuals to interpret your presentation or group conversation in real-time adds a whole dimension to your live event.
- Images, especially visual metaphor, can be used to explain difficult concepts
- Data and numbers can be made relatable and easier to understand
- Jargon can be more easily identified by an outsider, then it can be explained (or substituted for a more easily understood phrase)
- Information can be summarised, grouped, and presented as a visual story that piques the interest of the audience—at the end of the video, they can be directed to a website or other resource to find out more
- Key steps can be grouped, folded into a mnemonic device, or arranged spatially on the page in a way that is easier to remember
Read more about the different types of graphic recording.
Events that clients use us to capture
- Sketching presentations & conversations at staff conference
- Increasing engagement for virtual meetings of remote teams
- Visualising community engagement workshops
Other Services We Deliver To Government Clients
-
Learn about Explainer Videos

Explainer Videos
We bring your story, idea, or message to life with an engaging, hand-drawn video.
-
Learn about Training

Training
Empower your team with one of our visual thinking workshops, designed to get everyone drawing their ideas with confidence.
-
Learn about Illustration

Illustration
We can turn your strategy, vision, or values into a beautiful poster or slide deck that will inspire your whole team.

