

18/9/2020
We’ve just published the latest episode of The Sketchcast, the show showcasing people who are using sketching to change the world! In this episode I had the good fortune of chatting to Shirley Wu, whose data visualisations achieve that enviable balance of providing insight into large data sets, while at the same time still managing to be stunningly beautiful to look at.
We cover a range of topics, including:
- how she got started in the data visualisation field
- the process she follows for creating her amazing visualisations
- how she balances client work and personal projects
We also get a little side-tracked discussing our mutual love of Hamilton, the hip-hop musical (I edited most of this out, but there are a few funny Hamilton stories at the end, if you’re a fellow fan).
As always, I’ve peppered the interview with visual notes that I took of our chat, and I’ve also included a bunch of examples of Shirley’s work that really are amazing to explore. Who knew that data could look so beautiful?
That said, for those of you who like their podcasts while they’re driving or exercising, there’s an audio version version up on Soundcloud without all of the visual treats.
sketchgroup · Sketchcast Episode 2: Data Visualisation with Shirley Wu
Tools and websites mentioned in the show:
- D3
- Data Visualization Society
- Shirley’s website
- Datasketch|es
- Shirley’s interactive visualisation of every line in Hamilton, the musical
- One Anti-Racist Action A Day
Visual notes of the interview:
 There’s also a full transcript below. Leave me a comment—I’d love to hear who you think I should interview next!
Full transcript:
Matthew:
Hello, again, subscribers, viewers, listeners, sketchers. Welcome to the Sketchcast, the show that teaches you how to be amazing with sketching and where I get to interview people who are using sketching to change the world.
Matthew:
First up, thank you so much for everyone who listened or viewed the first episode and liked or shared or commented on it. It was so great to hear that so many of you thought this was a worthy exercise. I do apologize that I can’t commit to a tight schedule at this stage, but I do love doing these and I kind of figure, quality over quantity. So thank you for your patience and thank you for your support.
Matthew:
In today’s episode, I talk to Shirley Wu, the incredibly talented data visualizer from San Francisco. That’s right. Today’s guest does not use pens or markers to sketch, although that’s not really true, as you’ll hear later. She uses code and data. Her creations look stunning. They bring clarity and insight to large datasets. It’s such a great chat. I can’t wait for you to hear it. Shirley talks about her process, about the principles she uses to create her stunning data visualizations, about how she chooses her aesthetic, and we also get a bit sidetracked talking about hip-hop musicals, but that’s okay because everyone loves a bit of hip-hop musical theatre, right? As always, I’ve also created visual notes for this chat and included them throughout the interview. So hopefully, you find them amusing.
Matthew:
Today’s episode is brought to you by Sketch Group. At Sketch Group, we sketch your story. We believe sketching can be transformational and that the right images are the best way for your message to be heard, by the people who need to hear it. Our team of illustrators and graphic recorders have years of experience creating imagery for your brand, your conference or your remote workshop. Bring your story to life at sketchgroup.com.
Matthew:
Shirley Wu, welcome. It’s so great to have you on the show for a number of reasons, which we’ll get into in a minute. But before we start, tell me, how are you? How is life in San Francisco, as we navigate this weird thing that is 2020?
Shirley:
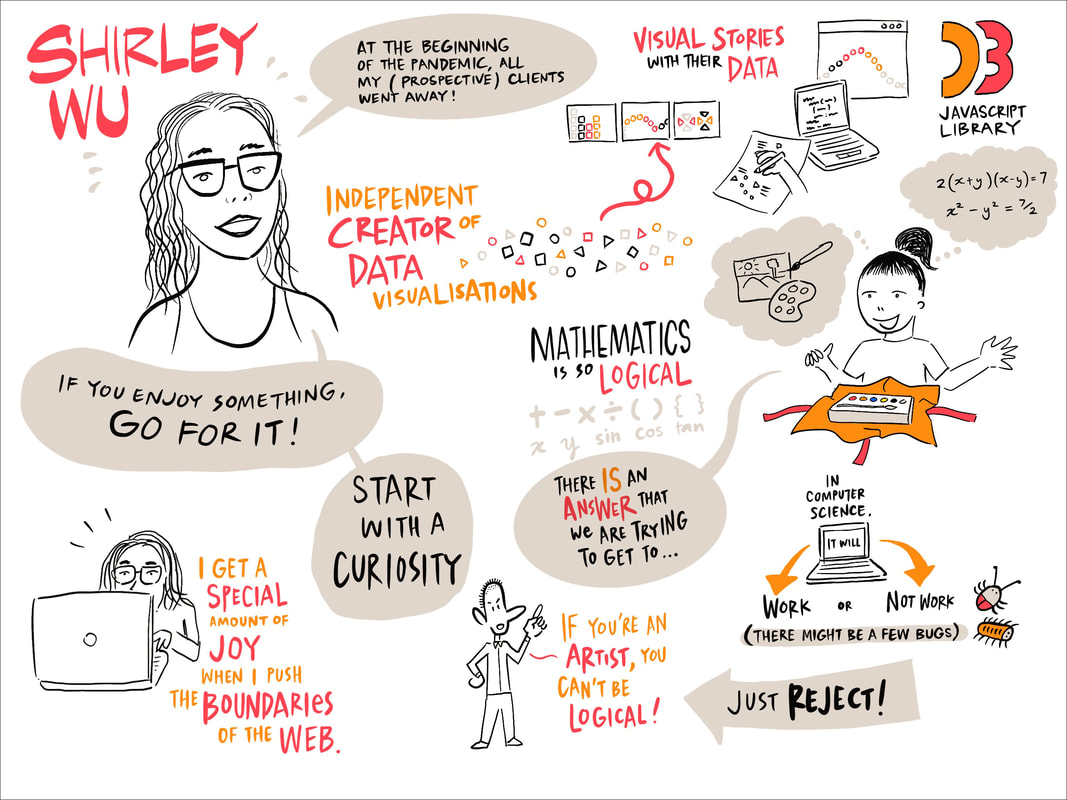
Yeah. It’s weird. I think you mentioned a little bit earlier about trying to figure out what to do in this time. Similarly, I’m a freelancer, and at the beginning of the pandemic, everything kind of… All of my clients kind of went away. So it’s been a very interesting time trying to figure out how to pick up the pieces and regroup.
Shirley:
But other than that, there’s a heatwave going on right now. So it’s really hot.
Matthew:
Wow. Yeah. So, well, I’m so glad to hear that you’re managing to survive and that you’re being distracted by the heat. Why don’t you start with you telling us your story, telling us how you came to be doing what you do and a little bit about yourself.
Shirley:
Yeah. So my name is Shirley, and the title I’ve given myself as a freelancer is an independent creator of data visualizations. And it’s just like a title that just means that I work with a bunch of different clients and I help them tell visual stories with their data. And so, oftentimes, they’ll have a dataset that they want to do something with and I’ll work with them, try and figure out if there’s anything interesting in there, I’ll design and prototype with them, and that’s where kind of the sketching part comes in. And then, I will code and implement the visualizations in the web.
Shirley:
And I guess how I came to it is kind of this, it felt roundabout but I guess it’s not at all, in that I studied business in a university and I thought I was going to go into finance. I really did not like it. I ended up picking up some computer science classes. And when I graduated, I started as a software engineer at a big data company. This was when people were still trying to figure out what big data was. And because of that, I got introduced to this JavaScript library called D3. And that is kind of now probably the defacto JavaScript library for creating data visualizations on the web. And that’s how I found out about this whole practice of turning data into visuals. And yeah, so it felt roundabout, but actually it was quite straightforward.
Matthew:
So often we think of people as having an affinity for one thing, like we might say, “She’s really into the arts,” or, “He’s really good at maths and programming,” but the work that you do, without fanboying too much, it is both beautiful and technically accomplished. I’ve also worked as a software developer in the past, so I can appreciate, I mean, you’re really kind of pushing the boundaries technically on some of… for what technology can do in the browser. So how does one go about becoming a polymath and deep-diving on more than one area? How do you learn?
Shirley:
Yeah, thank you so much. Yeah, like you said, even as a child, I really loved both sides. I loved art. And I think a relative gifted me a paint set when I was four, a watercolour paint set when I was four, and I kind of doodled all my life. I don’t know where those doodles are. I’m kind of scared to find them. So that’s why they’re not being shared. And I took art all four years of high school, but then when I went to university, somehow I convinced myself that I wasn’t going to do art because that’s not a way to make a living. So that’s how I started taking computer science classes.
Shirley:
But even growing up, at the same time as all of those doodling and art classes, I also always really enjoyed math. I really enjoyed how logical it was, that there is an answer that we’re trying to get to. I really loved that. And that’s the same thing with computer science. I really loved the, for most things, it’s there is a answer that we can get to. It’s either going to work or not work and it might have some bugs, but it will work or not work. And so, that’s kind of the driving factor of, I just have always loved both.
Shirley:
As for how to go about doing that, I’m not sure if I have a vice or anything. I think it’s just that I do feel that, as a society, we tend to just get so bogged down to like, “Oh, you need to specialize in this one thing.” Or you need to be either like, “If you’re an artist, you can’t be logical,” or all of those things that you just mentioned before.
Shirley:
And I guess the only thing I’ll say is, just reject that. I get frustrated with these kind of boxes that we put each other into and just, if you enjoy something, go for it. And for me, it’s like, I get a special amount of joy when I push the boundaries of the web. Some of the projects that you might have seen, I get a particular joy when I’m pushing it to the limit. Or one time I found a bug in Chrome, because of I was working in Canvas and it was just like, I just used it in a way they didn’t expect. And so, yeah, I just kind of enjoy that.
Matthew:
Amazing. So can you talk to me a bit about your process? How do you go about finding a dataset and then through to it looking beautiful and telling the story that evolves from the data?
Shirley:
Yeah, yeah, definitely. So one of the things that I firmly believe in is that, for me, it’s really important that I start with kind of a curiosity or an interest about something in the world. And what I mean by that is I think the way that you found me was through my visualization on Hamilton, the musical, and that one was, I was obsessed back in 2016. So I created the visualization in 2016. And I first learned about the musical in maybe mid-2016. And I was so obsessed. I loved it. I loved. You’ve also said this, you said that you and your whole family watched it. Yeah.
Matthew:
We can geek out about Hamilton later but yeah, go on.
Shirley:
At one point and I loved kind of the lyrics and I love how empowering it was. And this was just listening to the cast recording on Spotify. And even then, I just had it on repeat for months. And I was so obsessed that I started feeling like, “Oh, there’s all these repeated phrases. And there’s probably some really interesting analysis, like literary analysis we can do because it’s so intense. It’s so beautifully constructed and intentionally done.” And my husband was like, “Okay, why don’t you just make a visualization?” And I’m, “No, that’s too obsessive.” And then a few days later, I was like, “Okay, I’m that obsessive.” And so then I went out and I essentially made my own dataset because while the lyrics are online, the information about where the repeated phrases were… first of all, what is kind of this set of repeated phrases? Can we group them? Who sang them? Where did they sing them? And then additionally, who conversed with each other? Who kind of had the most co-occurrences? All of that wasn’t anything readily available online.
Shirley:
So I spent three days manually going through the lyrics twice, the first time around to kind of jot down all of that information and the second time to manually enter it. And that’s what I mean though, about having that curiosity, because I think that curiosity really drives me through some of the toughest points of creating something. Because I feel like, especially with self-motivated projects, there’s always that kind of slump where I don’t know how to get out of it. And I think when it’s something that’s motivated by my own curiosity, I tend to be able to come out on the other side of this.
Shirley:
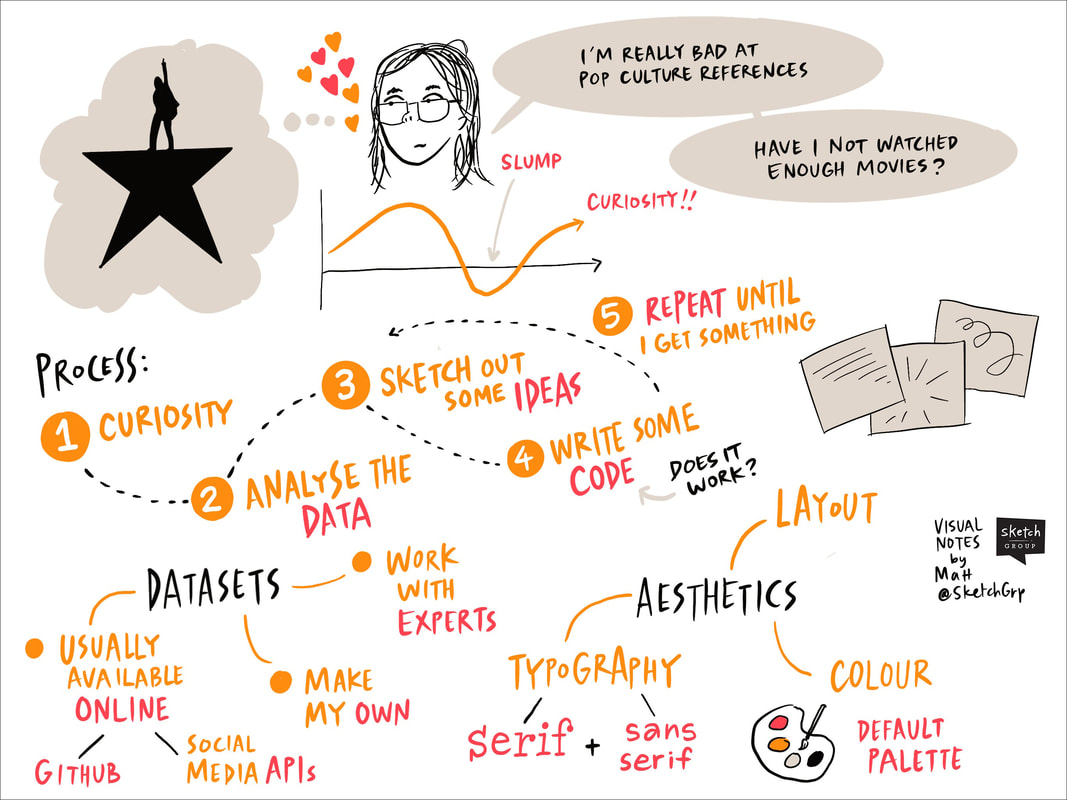
So always start with curiosity, and then it’s analyze the data, try and sketch out some ideas, and then see if it works with the data and kind of rinse, repeat with a sketch and a code until I get something.
Matthew:
Very cool. So we’ll share some of your sketches for some of the projects that you’ve worked on, but tell me how, apart from being obsessed with something because of music and the story, how else do you go about choosing projects?
Shirley:
Oh, yeah. So for quite a long time, so I have a project called Data Sketches with my friend, Nadieh Bremer, and that project was… the idea behind it was we would choose 12 different topics and we would go out and we would create a whole data visualization and we would document the whole process. And so for the longest time, it was kind of dictated by the topics that we chose together, and all of those topics were things that we thought would be really fun. So we started out with movies and then it was always kind of topics that were broad enough so that we can both have our own spin on it.
Shirley:
So for example, for movies, my personal curiosity was I’m really bad at pop culture references. And I’ve always thought that that’s because I just have never watched enough movies. So the visualization I did was I went and gathered all the top summer blockbuster movies, data on them, since I’ve been alive. And then I visualized their information. And then I also took a look at which ones I’ve actually watched. And it turns out I’ve only watched 17 of them. I was like, “Oh, this makes sense.”
Shirley:
But I guess it’s kind of things that I notice in my life and then get curious about. So there was another one in Data Sketches, we called it Myths and Legends. And for that particular one, I was trying to figure out what’s a legend or a myth that I’m really curious about. And it turned out that I realized that I couldn’t list as many notable women figures in history. And even thinking about my history textbooks, I just couldn’t think of that many women’s names. And that’s when I went and found a list of the women Nobel Laureates and that’s how I ended up visualizing that one.
Shirley:
So it really is just whatever I come across in life, in daily life. And I’m like, “Oh, I wonder.” And that’s how it happens. And other than that, it’s clients coming to me with a specific dataset.
Matthew:
And is the data that you’re after generally available for free online, or do you have to get creative in sourcing it?
Shirley:
It depends, again, because it’s just whatever I’m curious about. It depends. So for some of the most kind of serious and sensitive topics, those are ones that I usually have worked with a client, I’ve partnered with a client with, because either they have that dataset already.
Shirley:
So there’s an example where Nadieh and I worked with the Guardian, the US Guardian team on a story about homelessness in the United States. There’s a program in quite a few American cities where it’s called the Homeless Relocation Program and they buy bus tickets for homeless people to travel to a different city. In that particular dataset, the Guardian team, their reporters has spent 18 months gathering that data because they would kind of… I can’t remember what the name of it was, but then they would contact the city and ask for those records. And then they would, oftentimes because it was in PDF or even sometimes handwritten, they would manually enter it into Excel.
Shirley:
So in that case, I was lucky because as a non-journalist, I would probably not have access to that, but for some of the most kind of sensitive, it’s usually I try to work with experts, mostly because I wouldn’t have access to it. But for some of the kind of funner pop culture sort of things, it’s usually quite available online. It’s usually I’ll do some Google searches. And the tip I’ve found in terms of finding a dataset that is well-cleaned and well-formatted is to Google for the dataset, whatever the topic, and write GitHub. And if I include in the search term, GitHub, and it’ll usually turn up a GitHub repo of where someone has already gone and cleaned the dataset. So that is a little tip that I’ve learned over the years. But other than that, I’m… Sorry, what?
Matthew:
I just said, that’s a great tip.
Shirley:
Thank you. And then, APIs, many APIs, I tend to do a lot of, I get curious about the social media, I get curious about Instagram or YouTube videos. And so, they have really well-documented APIs. So any combination of those, usually, it’s some combination of automated scripts and manual entry, and it’s like a gradient.
Matthew:
Very good. So it’s okay. Excuse me. It’s one thing to be able to code the data and present it in the way that you want it. It’s another thing to make it look beautiful. What are your influences on the aesthetic that you choose? How have you landed upon the style for your visualizations?
Shirley:
Yeah, that’s a tough one. I feel like it’s kind of all over the place for me. I think I just experiment and then I’m like, “Oh, this looks pleasing.” A top-level answer is I just kind of try, I throw things and then see what sticks, but I guess to kind of try to be more specific about it, I feel like there’s, at least within kind of data visualization and information design, I feel like it’s a little bit different in practice from graphic design or visual design, in that, personally, I think to make it aesthetically pleasing, there’s two, maybe three main things that I’m trying to get a good balance of.
Shirley:
The first is typography, because information, and I do the lazy non-design student, like non-trained design, self-taught designer thing where I’m just like, “Oh, this one book about typefaces mentioned this typeface. So it must be a good one.” And I just choose that, I choose a serif font, and sometimes I’ll choose my default sans-serif and I just use those for every single project. And that’s been nice because then people are like, “Oh, this is Shirley’s work. Because it’s like a…”
Shirley:
Then the second thing is colour. So then, I usually with visualizations, colour is such a big, important visual channel for kind of communicating the information. So oftentimes, I’ll end up with either a very white background or a very dark background. And then, I can use colour to communicate something. So then I kind of have a colour palette that I, when I first started freelancing, I just made a colour palette for myself. And then that’s the colour palette that I choose from every time I do a project, which again, gives it a very similar feel between my projects.
Shirley:
Then the last one is kind of the layout and that one is really kind of dependent on the project, but yeah, so that’s from kind of like a visual side of how I go about things.
Shirley:
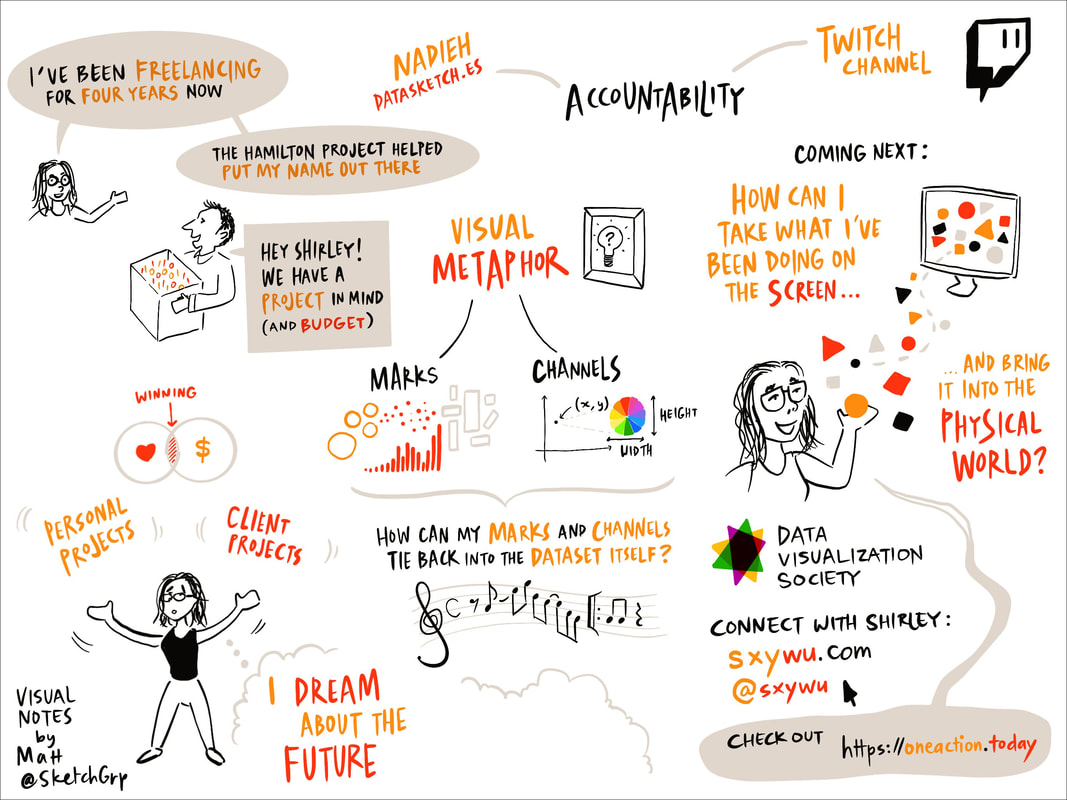
Then from kind of like a conceptual side, I really like this concept of a visual metaphor, which in data visualization is whatever visuals that you choose. So actually, let me back up a little bit and say that in visualization, there’s a concept called marks and channels. And so, what marks mean is these geometric shapes, so circles like dots or the rectangles or bars that you might map your data to, and visual channels are kind of the modifiers for that. So maybe the X, Y position in which you placed those marks or maybe the colour of it or the dimension, the width, height of it. And so, when I think about a visualization project, I sometimes try to think about what kind of marks or how can I choose some my marks or channels such that it actually ties back into the dataset itself.
Shirley:
So for the Hamilton one, because it was a musical, the way that I tried to represent the themes was kind of with these like kind of arts and characters that I was inspired from musical sheets. And so, that’s the kind of conceptually, I tried to think about visual metaphors that might help tie the dataset, the visualization back to the dataset.
Matthew:
It seems your business model is to make cool stuff and put it on the internet and then people see it and come and ask to work with you, which is not that dissimilar to how I started Sketch Group, making videos and doing graphic recording. Is that a viable business model? Is that your approach?
Shirley:
Yeah. So I’ve been freelancing for the last four years. Wait. Okay. So short answer is, I’m not sure. The longer answer is I’ve been doing this for four years and it’s worked out pretty well for me.
Shirley:
So the Hamilton project was in 2016, right after I went freelance. So that definitely helped put my name out there more. And all of the kind of subsequent projects that I’ve published have really helped. And so, there’s clients coming in, client requests coming in. I’m very grateful for it.
Shirley:
At the very beginning, the reason why I went this way of putting things out and then waiting for inbound client requests instead of cold-contacting any specific client was because I realized that data visualization was so niche, that most people that I thought I might want to work for or work with, either didn’t quite know what it was or didn’t quite know why they needed it, or even if they did, they didn’t have a budget available for it. So when I first started, I really kind of relied on people finding me and that way they already had a project in mind. They already had a budget in mind.
Shirley:
It’s been four years. And the way I think about it has changed a little bit in that I think I’ve gotten, for better or for worse, I’ve gotten a little bit pickier about the projects I take and the topics that I’m interested in. And so, I’m kind of at that weird limbo stage where I think that I’m too picky for the requests that are coming in and not reputable enough for all of the projects that I want to take on, if that makes sense. So I am trying my best to kind of start reaching out to organizations that I really respect and start trying to kind of pitch ideas or stories, but certainly, I feel very nervous doing that.
Matthew:
So these projects that you take on as your kind of personal portfolio, how do you manage your time between spending hours and hours, it must be, on them and paying the bills and doing the projects that people want to pay you money for? That must be a difficult tension to, a difficult balance, to maintain.
Shirley:
Yeah, definitely. It’s been quite difficult. I think the projects that I’ve felt have been, I guess, the most successful in terms of time management, have been those that I would have wanted to do on my own anyways, but just because personal projects I like to use as kind of experimentation for figuring out new technologies or new personal style or… So trying to find something that I want to do and then pitching clients to let me do it. And so, that way, the client project is the personal project. So those are the most successful ones, but obviously, that doesn’t happen all the time.
Shirley:
So there are definitely months, I go mostly just doing client projects and then once those are done, I try to do a little bit of my personal projects or it’s that I’m doing multiple at a time. And those are very confusing times because I’m just constantly context switching. And most of my projects take anywhere from a few weeks to a few months. And so, it gets to be a lot. I have some projects that I’ve just never been able to finish.
Shirley:
But sometimes, it’s also quite nice to have the personal project and client project to kind of bounce back and forth from, when I’m stuck on one or the other. So I don’t have a hard and fast rule of this is how I schedule myself. It’s kind of whenever the clients come in and whenever I schedule them. And then, other times, I like either… Well, so I guess currently for when COVID first started, it was that there were no clients I could schedule, but I also tried to take some time off between clients so that I could do kind of these personal projects.
Matthew:
And how important do you think it is having, I guess it’s like an accountability partner in Nadieh, in terms of moving those personal projects forward?
Shirley:
Oh yeah, definitely. I have this joke that I spend, or it’s not a joke, but it’s something I’ve accepted about myself that I like thinking and planning for the future more than I like… what’s the word? I dream more about the future than I do about the present. So I’m definitely between… And Nadieh’s very much, very focused on the present. So it works really well to work with her because I tend to be the one that’s like, “Oh. Here’s all the ideas, let’s do this with a project or let’s do.” So I’m always looking a few months ahead of what I want to do. And then she’s the one that’s like, “Shirley, you need to finish this project that you’re working on currently.” So I really appreciate it. And I definitely need that kind of accountability to be like, “Finish thing that’s present.”
Shirley:
So my newest thing is trying to do that via Twitch streams. So Twitch, I livestream my database projects; I’m going through the whole process of creating a data visualization on there right now, just because I realized that back in June and July, that I really lacked motivation. And so the Twitch stream was a way for me to hold myself accountable, to work on this project, no matter what.
Matthew:
Great. Can you give us any insight into what is coming next? What you’re working on? What’s in the pipeline?
Shirley:
Yeah. Yeah. So, like I mentioned earlier, I’m still trying to figure out how to regroup. I think I’m still little bit in the mourning phase of, there was a few clients I was talking to back in March that I was really excited about, and I’m now, months later, finally coming to the terms with the fact that it’s probably not going to happen anymore because of the budget freezes. But certainly at the beginning, in March, I went and did a personal project and that took up maybe two months in my time of… and it was a personal project about how a pandemic might spread through a community. And once I did that, I went into kind of this, “I don’t know what to do anymore now. I don’t know how to spend my time.” I’ve, I think, finally started to come out of that.
Shirley:
As of right now, I think I’m trying to keep it simple. I’ve been fortunate in that client requests are coming in again, they’re not at the level of the scale or the excitingness of the scope as it was before, but thankfully, they’re coming back in. So I’m just trying to kind of take… I’m trying really hard to just take the advantage of the fact that I don’t have that many client projects right now and kind of redo my portfolio, try and get better at more new skills.
Shirley:
And one of the biggest things that I’ve been trying to learn is how to bring the work I do out into a physical space. So kind of physical computing, and it’s been a dream of mine for a few years to do some sort of an installation. And so, kind of trying to take this time to explore more of different materials and different electronics and how I can incorporate the data and the projects that, the kind of projects I’ve always been doing in the screen and try and take it out to the three-dimensional world. So that is what I’m trying to get back to.
Matthew:
I can’t wait to see what that looks like. Shirley, do you have any tips or suggestions for folks listening who might be curious about pursuing a career in the data visualization world? What would you say to them?
Shirley:
Yeah, first of all, welcome. I feel like it’s a very welcome or it’s a very exciting time right now, just because there’s just so much data out there and we’re all trying to make sense of it now. And so, I would say that because of the amount of interest, there’s been organizations that have started, and the one that I refer to a lot is called Data Visualization Society. And I would say that they’re a quite a good place to get started with because they have been putting a lot of effort into gathering resources for people that are early career or people that are trying to get into data visualization. So they have fireside chats about different visualization topics and they have a whole section dedicated to just career advice for getting into data visualization. So it’s quite a good resource. So I think that would be a really great place to start.
Matthew:
Cool. And lastly, if people would like to follow along with your work online, how can they contact you? And are there any projects that you want to give a plug? Now’s your chance, this is your platform.
Shirley:
Oh yeah. Yeah. So my portfolio website is sxywu.com. And I’m that same as a handle on Twitter, Twitch, where I’m streaming, Instagram, YouTube, all of those things. So that’s my handle.
Shirley:
And I, actually, there’s a project that I’ve been enjoying recently in the last few weeks, and enjoying it is a weird word, but I’ve been extremely appreciating, which is called One Anti-Racist Action A Day. I think maybe you can Google just that, but it is a newsletter, a daily newsletter. It’s very short and it just says, “Today, this is the topic. Here’s what’s happening. Here’s the action you can take, and this is why it matters.” And it’s been really, really, really helpful to stay informed with everything that’s been going on in the US and in a very manageable… it doesn’t take over my life, but it’s something that I can do in the time that I’m checking my email every day.
Matthew:
Amazing. Shirley, thank you so much for your time, for all of your tips and your nuggets and advice. Keep doing beautiful work and we really appreciate it.
Shirley:
Thank you. Thank you so much. Thank you so much for having me on, Matt. Thank you for finding me and for bringing me on.
Matthew:
Awesome. And that is it for this episode of the Sketchcast. Be sure to subscribe so that you can stay updated when the next episode goes live. And if you have any suggestions for guests that you would like me to interview on this show, please get in touch. You can find out our contact details in the show notes. Until next time, stay sketchy.
Shirley:
And then, we managed to get in. So we managed to not only get in, but we paid $40 for standing room only. So it’s like all the way at the back of the theatre. So during the intermission, one of the ushers comes up to us. He’s like, “Hey,” so pointing to, it’s orchestra, it’s middle of orchestra, like all the way to the side. He’s like, “Whoever is in those two seats have not shown up all of the first act. If, by the end of intermission, nobody has claimed those seats, you should just go sit down.” So for the second half, we sat down in orchestra and it was amazing.
Matthew:
Wow.
Shirley:
Yeah. I cried so hard throughout most of the second act.
Matthew:
My partner and I went, my daughters stayed at home, and while we were there, there were tickets that were available. And so we definitely paid a lot more than $40, but we were sitting fourth row from the front. So we had amazing seats for the whole show as well. And I guess I knew that I would be able to go and see it. It was just a question of whether I was prepared to spend half of my life savings to buy a ticket to justify it. And then-
Shirley:
I wasn’t going to say this in the middle, but your daughter didn’t get to see it.
Matthew:
I thought she would be excited when I called her from the lineup, saying, “Guess what I’m going to see?” Apparently, she was really pissed off at me.
Shirley:
If I was the one that introduced you and then you were like, “Guess what I’m going to go do what you can’t do?” I’d be like, “What?”
Matthew:
I promised her I’d take her to see it in Sydney next year. So she’s got that to look forward to.
Shirley:
Just from an artistic standpoint of how everything, every one of those work together, but kind of like, you must have felt it, when you were in the room, in the theatre, the pure energy of not only the cast on stage, but the audience that’s just so excited to be there. I feel like there was clapping after every song, standing ovation after, the energy in the room is amazing.
Matthew:
Absolutely. Absolutely. We got sidetracked there …